11 Feb Monitor MDaemon server load using Perfmon
 Out of the box MDaemon has some very detailed logging and real-time statistics built into the application.
In this post I’ll show you how to learn more about what a server’s doing using the free Performance Monitor feature in Windows.
From within MDaemon’s GUI you’ll find detailed information about many different aspects of the server load including:
- number of messages in specific queues
- number of active sessions for each of the MDaemon services
- status of those services
- whether queues are frozen
For a mail server administrator, it is very useful to see live statistics change on the server but often the important changes in a server’s load don’t conveniently happen when the administrator is staring at the console.
So how can we see what the load on an MDaemon server was yesterday evening? This is where the Performance Monitor included with Windows can come to our assistance….
From MDaemon version 13.5 onwards, a new set of performance counters have been added and by using the Windows Performance Monitor (PerfMon) we can graph and collate these statistics over time to allow us to look back at the status of the server.
Configuring Windows Performance Monitor
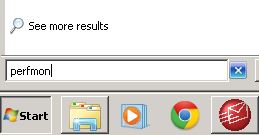
Step 1 Click on Start button and type perfmon in the search bar to create a simple Data Collector Set. Please note on 64 bit systems you will need to type mmc /32 perfmon.msc
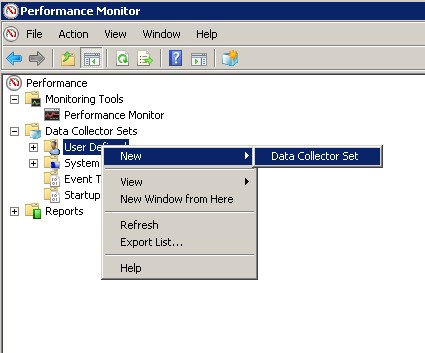
Step 2 Navigate into Data Collector Sets > User Defined , and right-click to choose New > Data Collector Sets.
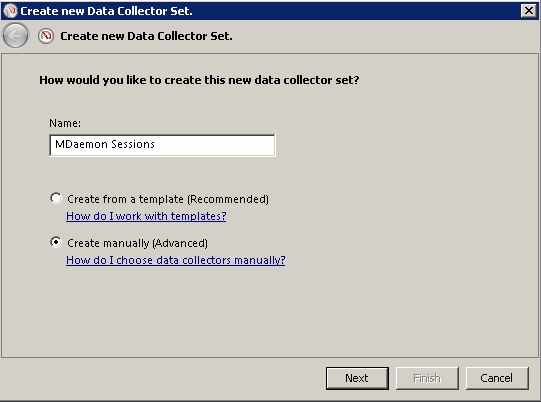
Step 3 First let’s give this data set a name. I’ve chosen ‘MDaemon Sessions’. Then select the manual option and click next.
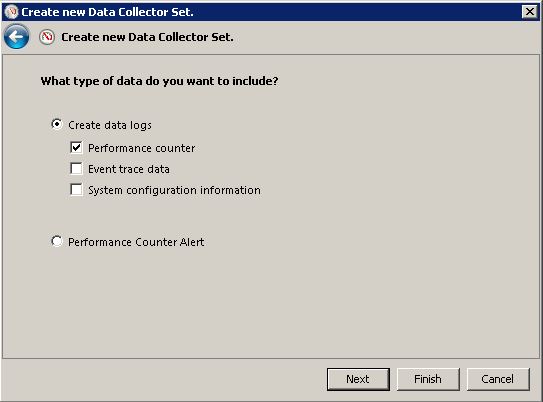
Step 4 Next Choose ‘Performance Counter’ and click Next.
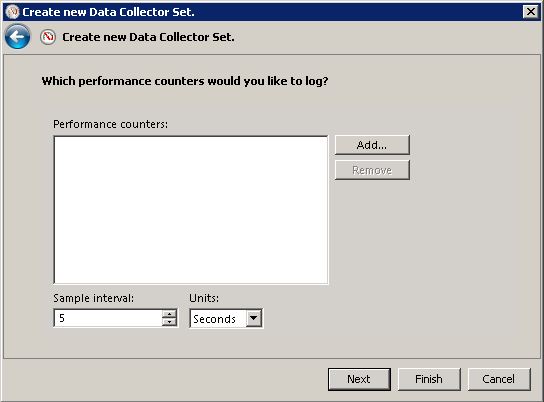
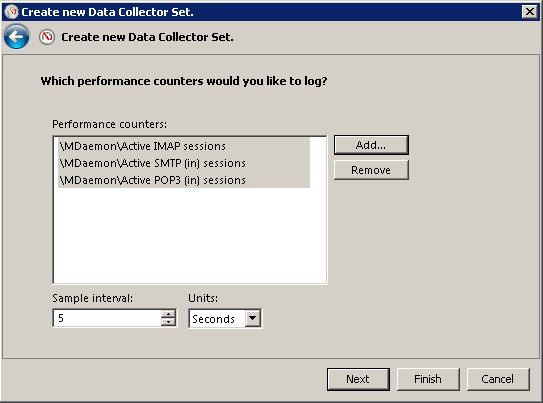
Step 5 On the next page we need to set the sample interval, I will choose 5 seconds and select ‘add’ to add one or more counters to monitor.
Step 6 Under the ‘Available counters’ section on the left you can scroll down to the MDaemon section and expand it to see the available MDaemon counters we can select.
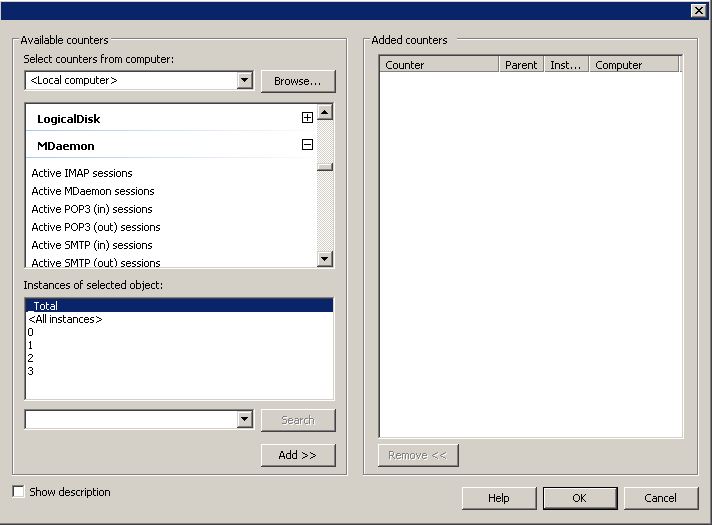
Step 7 If you tick the ‘Show Description’ tick box you can then click through each counter to see what data it represents, or for a full list of the counters have a look at this list here.
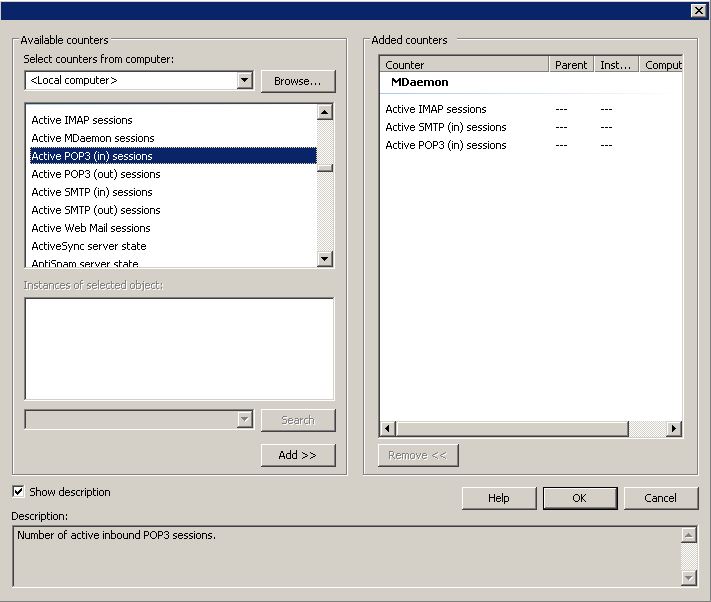
For this example let’s monitor the number of active IMAP, POP3 and SMTP sessions
Choose ‘add’ to add each counter once done click OK to finish
Step 8 You should now see a final confirmation screen showing the counters you will add to this Data Collector set
Choose Next to confirm these settings and continue
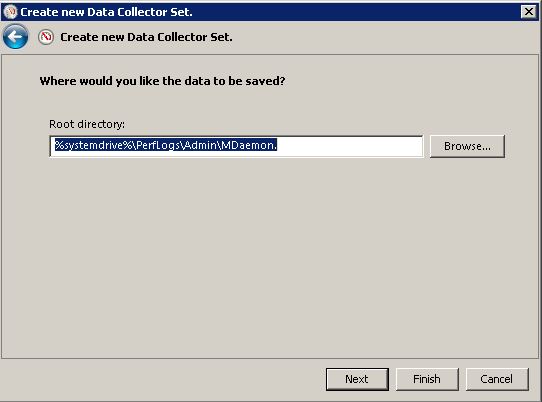
Step 9 You can now choose the location to save the data files or leave it in the default location and choose next.
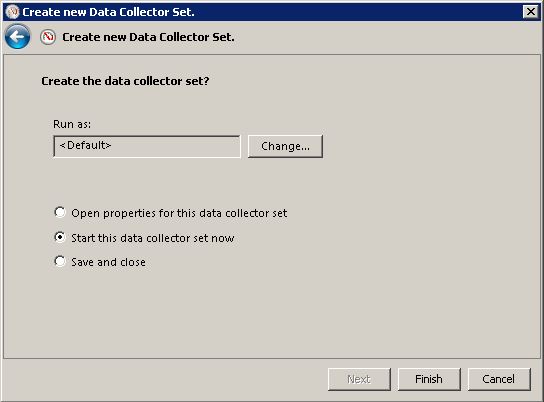
Step 10 On the final screen choose to start the Data Collector Set and click finish.
Step 11 You should now see the new Data Collector Set is configured and running, and the first report is being generated.
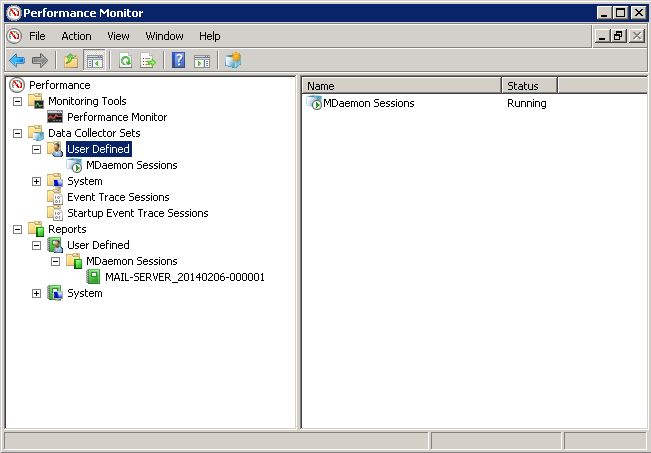
It’s worth noting you can only look at the performance monitor graphs within a report once it is no longer being written to. With this in mind, you must either manually stop the logging or wait until the next daily log is created.
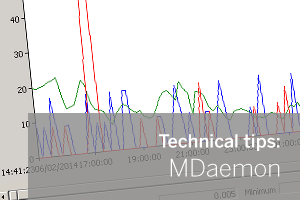
24 hours later we can see that we have successfully logged the sessions overnight…
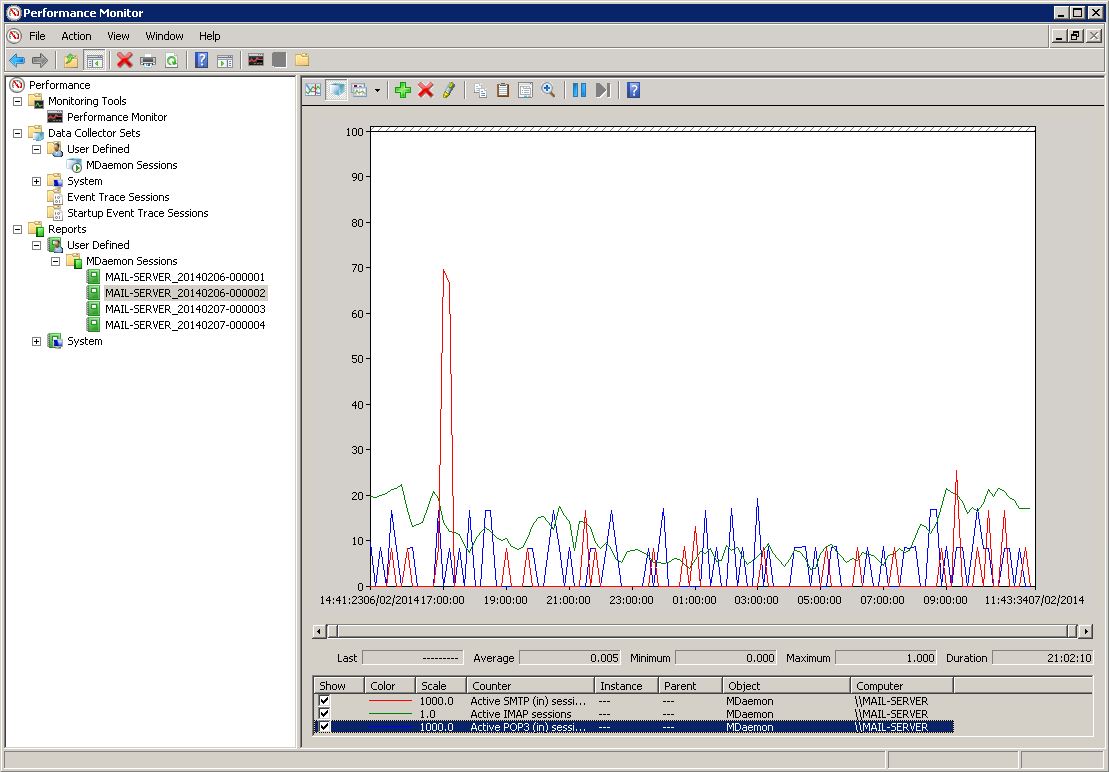
You’re can now able zoom into this data to get a better understanding of the load at different times of day.
Pay attention to the scale factor!
Performance monitor does adjust the scale values to try to show multiple graphs on the same page when the values are very different, so in this example the red SMTP sessions would look to peak to 70 but you can see that the scale value is 1000 so actually this is actually an average of 0.07 during that time period. For this reason it is often more logical to graph each item individually, however this is more work and will also create more logs.
Hopefully you can see how this can be useful for logging and graphing a wide range of MDaemon statistics and don’t forget, you can add any number of server statistics to the log such as CPU load or available memory.
Hopefully you’ll find this useful in helping spot those bottlenecks that are happening when many unexpected sessions are being dealt with at the same time.
Let me know how you get on in the comments section…
– – – – – – – – – – – – – – – – – – – – – – – – – – – – – – – – – – – – – – – – – – – – – – – – – – – – – – – –
![]() Try any of our software completely free for 30-days:
Try any of our software completely free for 30-days:
MDaemon email server | BackupAssist | MailStore email archiver