11
Feb
Monitor MDaemon server load using Perfmon
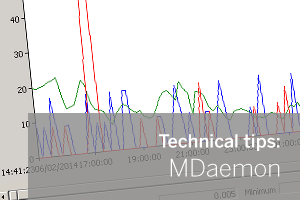 Out of the box MDaemon has some very detailed logging and real-time statistics built into the application.
In this post I'll show you how to learn more about what a server's doing using the free Performance Monitor feature in Windows.
Out of the box MDaemon has some very detailed logging and real-time statistics built into the application.
In this post I'll show you how to learn more about what a server's doing using the free Performance Monitor feature in Windows.