By default Untangle dashboard uses a range of widgets and graphs that show data and these are predefined. The ‘Bandwidth Usage’ graph is a common and very useful graph that shows the Total, Send and Received traffic live:
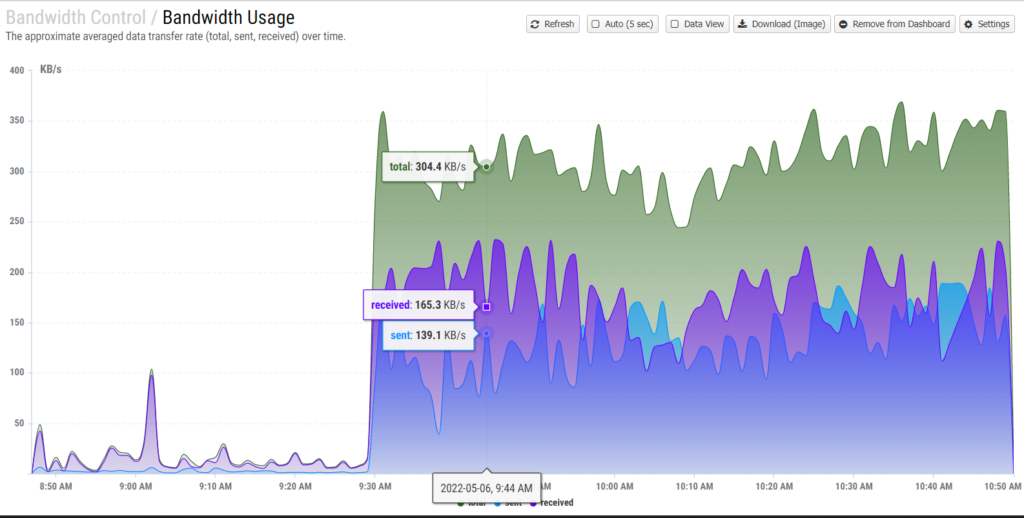
It is common in the UK to measure bandwidth in mbps rather than KB/s so its desirable to change this in untangle.
You cannot change the predefined graphs but you can copy them and edit them as you wish.
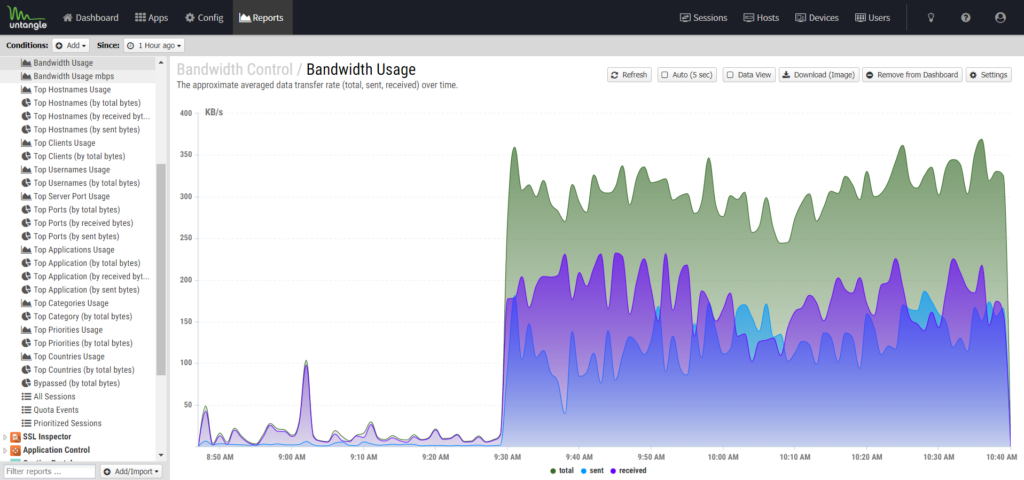
To do this first select the Bandwidth Usage graph by clicking on its name. This should show it full screen with the full list of reports on the left>:
From here select the Settings button on the top right::
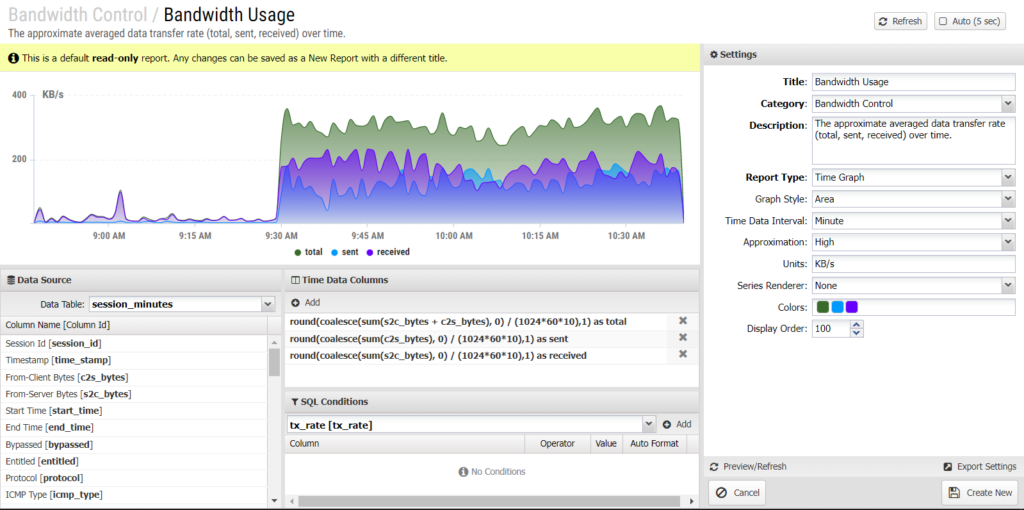
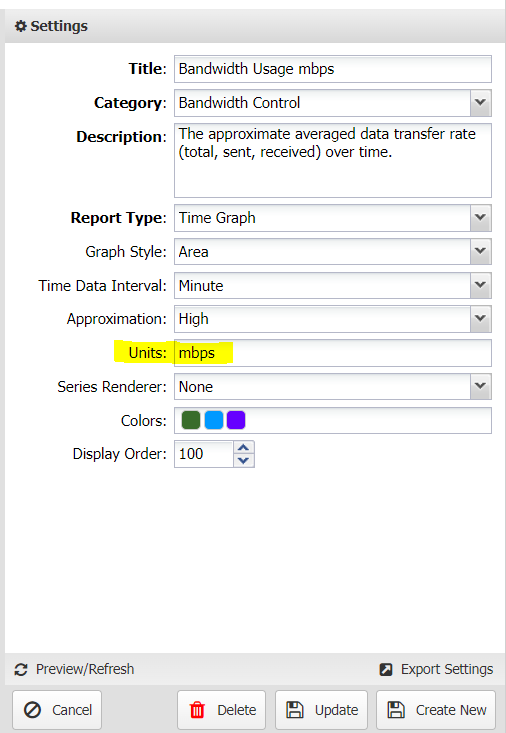
As this is a default report, it is read only and so the first thing we must do is change the title to something new. We will use Bandwidth Usage mbps and click on Create New to clone this report but with a new name…
You should now have a new report that you can edit.
We now need to change the Units from KB/s to mbps:
Next we need to edit the Time Data Columns section to convert the values into mbps from KB/s:
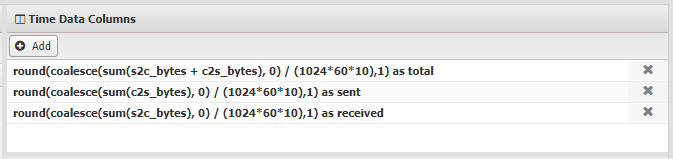
The three existing columns for ‘Total’, ‘Sent’ and ‘Received’ use the formulas.:
round(coalesce(sum(s2c_bytes + c2s_bytes), 0) / (1024*60*10),1) as total
round(coalesce(sum(c2s_bytes), 0) / (1024*60*10),1) as sent
round(coalesce(sum(s2c_bytes), 0) / (1024*60*10),1) as received
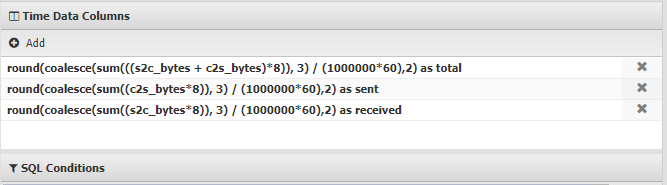
These need to be replaced individually with the calculations:
round(coalesce(sum(((s2c_bytes + c2s_bytes)*8)), 3) / (1000000*60),2) as total
round(coalesce(sum((c2s_bytes*8)), 3) / (1000000*60),2) as sent
round(coalesce(sum((s2c_bytes*8)), 3) / (1000000*60),2) as received
Take the byte and convert it to a bit (bytes*8), round to three decimals, convert to Mbits (1,000,000), then sec to 1 min
Once replaced your report should look like this and you can click the ‘Update’ button to save your changes..
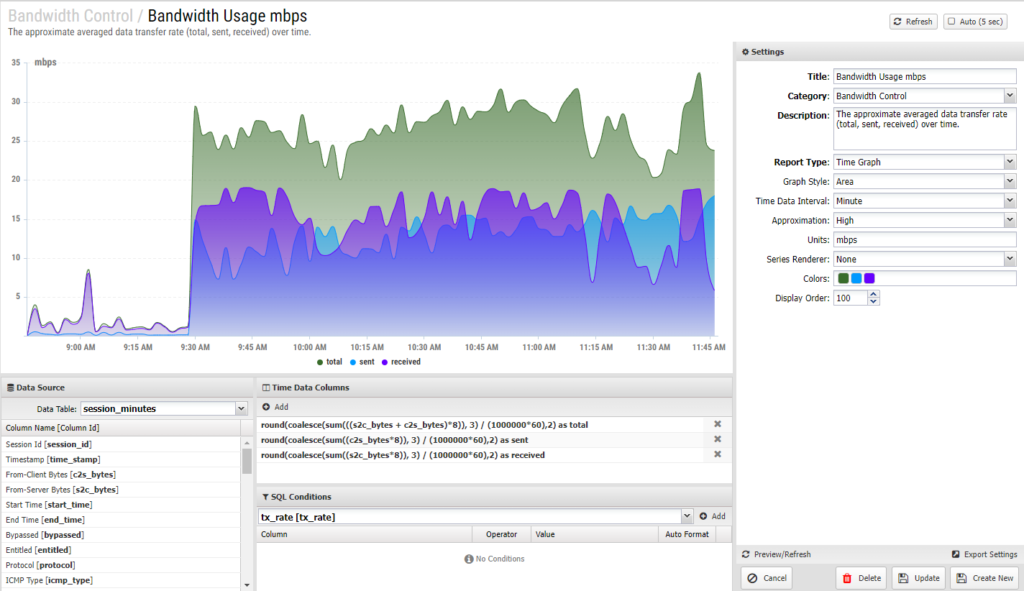
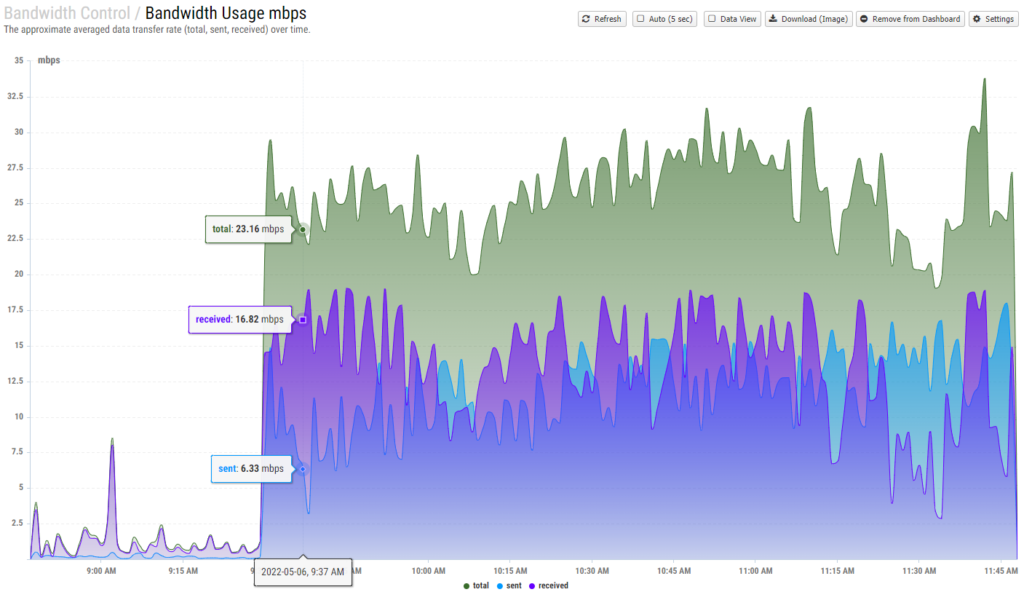
So, now when you view that report the values are shown in mbps not KB/s as they are in the default graph: